Dashboards
The dashboards provide a summary of the analysis used to compile the 2020 Update report. Two versions are provided: a summary dashboard and a full dashboard.
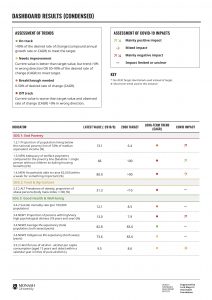
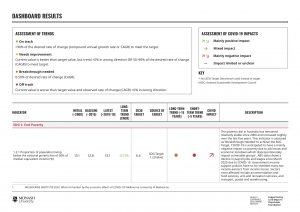
The full dashboard contains information for each SDG indicator on: key data points (the first and latest data points, and a data point for 2015), the long term trend (or compound annual growth rate), the 2030 target or benchmark value (and source), a 'traffic light' assessment of progress towards each target (based on long-term and short-term trends), and a qualitative assessment of COVID-19 impacts (expressed as 'arrows'). Interpretation of the results is also included. Charts for each indicator, which provide access to all of the underlying data, are available through the Explore by Goal section of this website.
The brief summary dashboard provides a redacted version, with information for each SDG indicator on the latest data point and 2030 target value, as well as the 'traffic light' and COVID impact assessments. The summary dashboard is also included in the 2020 Update report, located here. For more information on the assessment methods, click here.
For a graphic summary of a selection of key indicators, click on Analysis - Infographics.