
Outline of Method for the Transforming Australia Assessment 2020
This is the second Transforming Australia SDG Progress Report 2020 (TA 2020). It follows the inaugural Transforming Australia 2018 report (TA 2018) (found here) which provided a comprehensive baseline assessment of Australia’s progress on all 17 SDGs, addressing 86 priority targets and 144 indicators.
Drawing on the latest data, this assessment provides an updated report card on Australia’s progress on the SDGs leading into the COVID-19 crisis in 2020, focusing on 38 priority targets and 56 indicators. It also evaluates the impact that COVID-19 is expected to have on Australia’s ability to achieve the SDGs by 2030, drawing on available data and evidence. Results are presented as a summary dashboard and a series of interactive charts.
The methods applied in the assessment are based on the approach developed for the first progress report and have been peer-reviewed¹. Important methodological considerations for the assessment relate to the selection of indicators, the setting of 2030 target values, and the methods applied to evaluate progress towards the SDGs. In all cases, decisions were made by the project team drawing on advice from experts.
Selection of Indicators
The selection of SDG targets and indicators for this assessment was informed by the indicator framework developed for the 2018 assessment which underwent broad consultation with experts and stakeholders. For this assessment, a limited set of higher priority SDG targets and indicators were selected based on the following set of criteria:
- Relevance for Australia’s COVID-19 recovery
- Availability of updated time series data since the TA 2018 assessment
- Potential for the indicator to tell a compelling story
- Balance of economic, social, environmental issues
- Availability of target/benchmark values
- Relevance for key SDG transformations² identified by experts
Selection of 2030 Target Values
An important advancement for this assessment is the proposal of 2030 target or benchmark values for Australia for all indicators. This is important as it enables a more robust assessment of Australia’s progress on the SDGs and highlights the scale and pace of transformations needed to achieve the goals by 2030. However, the official SDGs framework fails to set quantitative target values for most indicators. The 2030 Agenda places responsibility on national governments to set their own targets in line with the global level of ambition and in consultation with relevant stakeholders.
Identifying appropriate national target values for this assessment was challenging as Australia still lacks official government targets for most indicators. Setting target values can be subjective in terms of different perspectives on the desired level of ambition, priorities and feasibility. Given that only 10 years remain to achieve the SDGs, this assessment proposes an initial set of 2030 target values for Australia with the aim of starting a national conversation. In all cases, target and benchmark values were selected based on available evidence and the following decision process (in order of preference):
- Numerical SDG targets from the official SDG framework;
- Existing national targets, for example from the Council of Australian Governments (COAG) or national strategies;
- Targets set by the National Sustainable Development Council (NSDC) for the 2018 assessment;
- Targets/benchmarks sourced from other global and regional assessments of the SDGs, including the Sustainable Development Solutions Network’s global SDG index or United Nations publications;
- Targets/benchmarks based on a comparison with top-performing peer countries (e.g. an average of OECD top five performing countries) or optimal historical performance;
- Benchmarks set based on a steady improvement on the 2015 baseline value of 1% per annum to 2030 (using a compound annual growth rate).
Method for Assessing Progress and Compiling Australia’s SDG Performance Dashboard
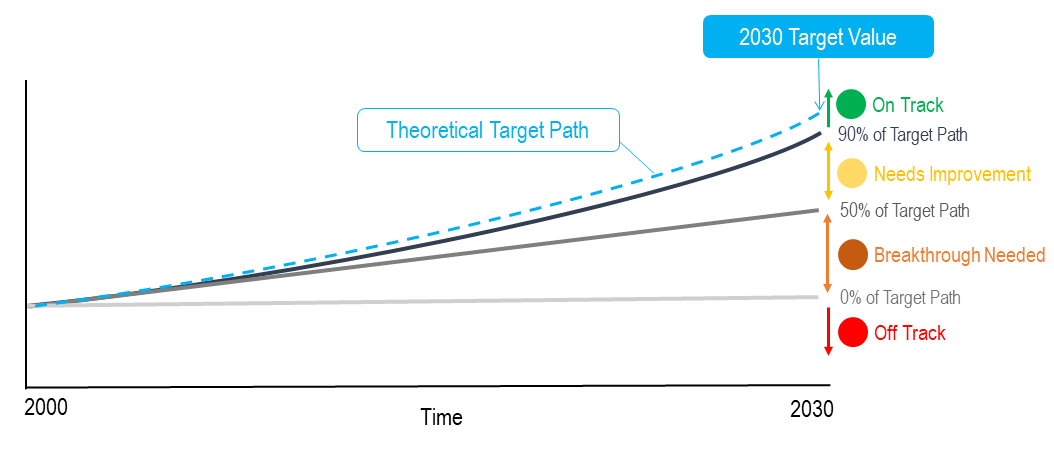
The quantitative method for assessing progress combines an analysis of time series data and 2030 target values for each indicator. Conceptually, the historic trend in data observed for each indicator is compared against the theoretical trend that would be needed to achieve a quantitative target in 2030 – or a theoretical ‘Target Path’. This allows for an easy visual comparison on how Australia is tracking for each indicator. In simple terms, a quantitative comparison is made between Australia’s actual progress and the progress that would be needed to reach the 2030 target, which is expressed as a percentage of progress. The results are then interpreted using a set of traffic light symbols (![]()
![]()
![]()
![]() ) which provide a dashboard assessment of how Australia is tracking on each target (Figure).
) which provide a dashboard assessment of how Australia is tracking on each target (Figure).
Where available, timeseries data were collected from the year 2000 until the latest available year (generally 2018/19). Data was collected from official national sources including the Australian Bureau of Statistics (ABS) and government administrative databases, as well as official data from international sources including the Organisation for Economic Cooperation and Development (OECD) and the United Nations (UN). All data sources are provided.
The assessment of trends is based on the ‘compound annual growth rate’ (CAGR) formula, which assesses the pace and direction of the evolution of an indicator. This formula uses the data from the first and the last years of the analysed time series to calculate an average annual compounded rate of change (%). To assess progress, the actual rate of change of the indicator based on the observed CAGR (1) is compared against the desired rate of change that would be required to meet the specified target value in 2030. This comparison calculates a ratio (R) by dividing the observed rate (CAGRO) by the desired rate (CAGRD) (2).
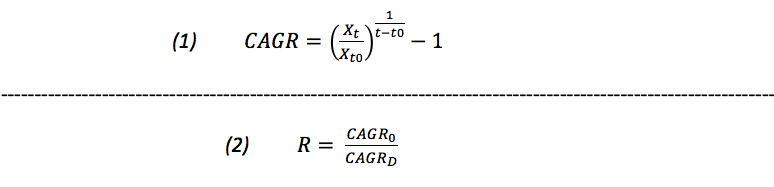
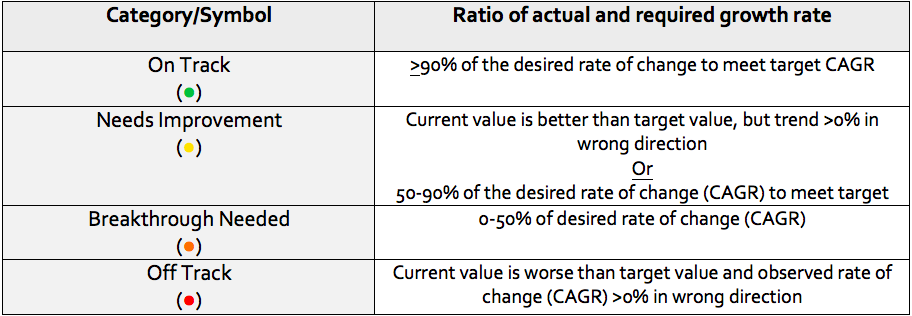
Table 1 provides a description of the thresholds used for evaluating the calculated ratio (R) and allocating the traffic light symbols as per the Figure. One of four assessment results is possible for each indicator: ‘On Track’, ‘Needs Improvement’, ‘Breakthrough Needed’, and ‘Off Track. For the dashboard, the assessment evaluates both the long-term trend (from 2000 to latest data point) as well as the short-term trend (last 5 years of data), where available.
Evaluation of COVID-19 Impacts on SDG indicators
The impacts of COVID-19 on SDG targets and indicators were evaluated with available data and evidence drawn from the ABS statistical collections, rapid surveys, and the expert literature. Available data was compiled into additional COVID-19 impact charts which accompany relevant indicators. In addition, a qualitative analysis of COVID-19 impacts on each indicator is provided in the dashboard and trend charts. Arrow symbols are used to provide an evaluation of the anticipated impact of COVID-19 on each indicator, ranging from mainly positive to mainly negative (Table 2). These symbols are included in the dashboard and trend charts for ease of reference.
¹ ALLEN, C., REID, M., THWAITES, J., GLOVER, R. & KESTIN, T. 2019. Assessing national progress and priorities for the Sustainable Development Goals (SDGs): experience from Australia. Sustainability Science, published online 4 July 2019. https://doi.org/10.1007/s11625-019-00711-x
² SACHS, J. D., SCHMIDT-TRAUB, G., MAZZUCATO, M., MESSNER, D., NAKICENOVIC, N. & ROCKSTRÖM, J. 2019. Six transformations to achieve the sustainable development goals. Nature Sustainability, 2, 805-814. https://doi.org/10.1038/s41893-019-0352-9